
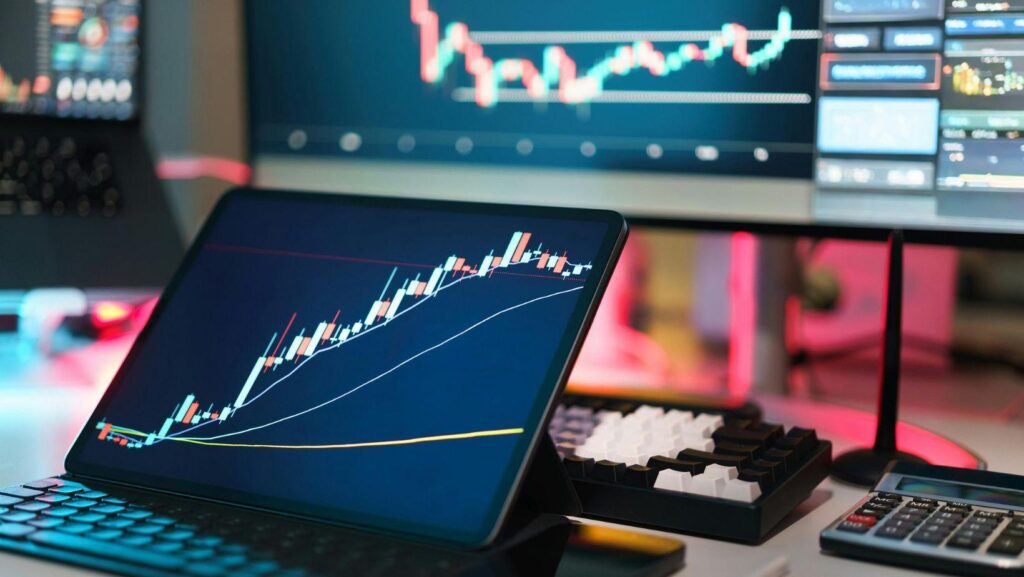
Quick Summary: What is Momentum Trading?
Momentum trading is a fast-paced financial strategy where traders buy assets that are rising and sell them after they have peaked, or short-sell falling assets to capitalise on downward momentum. Rather than evaluating a company’s long-term fundamental value, momentum traders focus entirely on price action, volume, and order flow liquidity.
- The Goal: To capture the middle, most explosive part of a market trend.
- The Catalyst: Driven by earnings reports, breaking news, macroeconomic data, or heavy institutional order flow.
- The Tools: Requires direct market access, Level 2 order book visibility, and high-speed execution platforms like Bookmap.
- The Edge: Success relies on advanced risk management and the ability to visually interpret market liquidity before the crowd reacts.
Core Principles of Momentum Trading
To consistently profit from high-velocity markets, traders must build their approach on structurally sound foundations.
Trend following strategies
The primary rule of momentum is that an object in motion tends to stay in motion. Trend following strategies do not attempt to catch the absolute bottom or top of a market. Instead, traders wait for a clear directional bias to establish itself, entering the market on the first minor pullback. By aligning with the dominant trend, you ensure that institutional capital is pushing the asset in your favour.
Riding market velocity
Velocity is the speed at which an asset changes price. Riding market velocity requires tools that process data without lag. When an asset experiences a sudden surge in buying pressure, the limit order book rapidly thins out. Traders who can visualise this lack of liquidity use order flow platforms to ride the sudden price vacuum, securing profits in a matter of minutes or even seconds.
Directional breakout investing
While traditional investing focuses on holding assets for years, directional breakout investing bridges the gap between day trading and swing trading. Traders look for multi-week or multi-month consolidation zones. When the price breaks out of this range on exceptionally high volume, momentum traders initiate positions, expecting the psychological shift to trigger a sustained run.
Broad Contexts and Methodologies
Understanding the broader environment is essential before applying specific chart tactics.
Active day speculation methods
Unlike passive index funds, active day speculation methods require a trader’s full attention during market hours. These methods rely on capitalising on intraday inefficiencies. Whether trading equities or derivatives, the focus remains strictly on intraday liquidity shifts and ending the day without overnight exposure risk.
Short term financial techniques
Short term financial techniques encompass scalping, day trading, and high-frequency execution. These techniques demand rigorous discipline. Because you are holding assets for brief periods, the impact of brokerage commissions and bid-ask spreads is magnified. Connecting directly to exchange data feeds is non-negotiable for executing these techniques profitably.
Quantitative equity concepts
Modern momentum is heavily driven by algorithms. Understanding quantitative equity concepts—such as Cumulative Volume Delta (CVD), volume-weighted average price (VWAP), and standard deviation channels—allows retail traders to interpret the mathematical formulas driving institutional buying. By visualising these metrics, you can spot algorithmic footprints in the market.
Technical Setups and Strategy Specifications
Executing a momentum trade requires precise setups. Here are the most effective patterns used by professionals in 2026.
MACD histogram divergence setups
The Moving Average Convergence Divergence (MACD) is a staple for momentum analysis. MACD histogram divergence setups occur when the price of an asset makes a new high, but the histogram makes a lower high. This signals that the upward momentum is decelerating, offering an excellent opportunity to take profits or initiate a counter-trend short position before the reversal becomes obvious.
Gap and go morning routines
The opening bell is the most volatile period of the day. “Gap and go morning routines” focus on stocks that open significantly higher than their previous close due to overnight news. Momentum traders monitor the first 5 to 15 minutes of trading. If the asset holds its pre-market support and breaks the opening minute high, it triggers a rapid “go” sequence as short-sellers are forced to cover.
Bull flag pattern recognition
Bull flag pattern recognition is vital for entering established trends safely. After an initial surge in price (the flagpole), the asset typically consolidates in a tight, downward-sloping channel (the flag) on lighter volume. Momentum traders buy the breakout of the upper trendline as volume returns, capturing the next leg up.
RSI overbought conditions scalping
Traditional theory dictates selling when the Relative Strength Index (RSI) goes over 70 (overbought). However, in true momentum environments, an asset can remain overbought for extended periods. RSI overbought conditions scalping involves buying into extreme strength. When the RSI locks above 80 on high volume, momentum traders scalp the relentless, algorithmic buying pressure, ignoring traditional mean-reversion logic.
The Mechanics of Market Movement
Accelerated price action tracking
Standard candlestick charts aggregate data, hiding the true mechanics of the market. Accelerated price action tracking involves viewing the raw, tick-by-tick order flow. By using a heatmap to track limit orders, traders can see exactly where price action will accelerate—typically where large pockets of liquidity (stop-losses) are clustered.
Capturing fast upward trajectories
Capturing fast upward trajectories is not about guessing; it is about evidence. When a massive sell limit order (resistance) is fully absorbed by aggressive market buyers, the artificial ceiling is removed. This absorption event is the exact moment a fast upward trajectory begins, providing a highly reliable entry signal.
High relative volume assets
Momentum cannot exist without volume. High relative volume assets (stocks trading significantly above their 30-day average volume) are the lifeblood of this strategy. High RVOL guarantees that enough market participants are present to facilitate fast execution and tight spreads, reducing slippage.
Framing Your Trading Approach
To streamline your success, you must ask yourself critical questions about your trading style.
Are you seeking intraday stock ideas or macroeconomic shifts?
Your data needs depend entirely on your timeframe. If you are focused on macroeconomic shifts, you need geopolitical news feeds and interest rate trackers. However, if you are asking “Are you seeking intraday stock ideas or macroeconomic shifts?” and leaning towards intraday action, your primary focus must be on pre-market volume scanners and real-time order flow data.
Do you require algorithmic scripting resources or manual chart tutorials?
As you progress, automation becomes a consideration. Do you require algorithmic scripting resources or manual chart tutorials? Beginners benefit from manual chart tutorials to build intuition. Advanced quantitative traders, however, require sophisticated Application Programming Interfaces (APIs). Bookmap caters to both, offering an intuitive visual interface for manual traders and robust Java/Python APIs for algorithmic developers.
Is your focus crypto futures or foreign exchange pairs?
Different markets operate on different schedules and volatility profiles. Is your focus crypto futures or foreign exchange pairs? Crypto futures offer 24/7 momentum and extreme volatility, while forex pairs tend to trend based on scheduled central bank releases. Ensure your trading platform connects seamlessly to your chosen market’s data feeds.
5 Best Indicators to Identify Surges (Listicle)
Best indicators to identify surges
Relying on the right data makes all the difference. Here are the top five indicators for momentum traders:
- Order Book Heatmaps: The ultimate leading indicator. By visually tracking resting limit orders, you can see where major surges will halt or accelerate.
- Cumulative Volume Delta (CVD): Measures the net difference between aggressive buyers and sellers. A rising CVD during a price consolidation signals an impending upward surge.
- Volume-Weighted Average Price (VWAP): Institutional traders use VWAP to gauge fair value. A strong break above the VWAP with increasing volume confirms a valid momentum surge.
- Relative Volume (RVOL): Identifies assets experiencing unusual interest compared to their historical average.
- Iceberg Order Detectors: Reveals hidden institutional orders. Finding where smart money is covertly accumulating assets allows you to enter before the surge.
Practical Applications: Scanners and Risk Management
Top scanners finding daily percent gainers
You cannot trade momentum if you cannot find it. The top scanners finding daily percent gainers filter thousands of assets in real-time. Traders configure these tools to alert them to stocks gapping up over 4% pre-market, accompanied by a minimum of 500,000 shares traded before the opening bell. Integrating a high-quality scanner with an order flow platform ensures you are always watching the day’s hottest assets.
How set protective stops during volatile spikes
Risk management is the only thing standing between a trader and a blown account. When asked how set protective stops during volatile spikes, professionals do not use arbitrary percentage drops. Instead, they place stop-loss orders just beneath large blocks of resting limit liquidity. If that liquidity is consumed, the market structure has broken, and the trade is invalidated. Always use hard stop-losses; mental stops fail during extreme volatility.
Why Choose Bookmap for Momentum Trading
When trading velocity, delayed information is useless. Bookmap is widely regarded as the industry’s premier visual order flow platform, offering a distinctive edge for momentum traders.
- Visualise the Unseen: Bookmap’s proprietary heatmap renders the entire limit order book in high definition. You can see the actual supply and demand driving the momentum, not just past price bars.
- Identify Institutional Footprints: With advanced features like the Iceberg Detector and Volume Bubbles, you can spot when large players are absorbing retail volume, giving you the confidence to enter breakout trades.
- Unmatched Speed: Operating with sub-millisecond precision, Bookmap processes raw, non-aggregated data feeds, ensuring you see the surge exactly as it happens.
- Customisable API: Whether you trade manually or deploy complex quantitative algorithms, Bookmap’s infrastructure supports your growth.
[Book a Consultation] | [Speak to an Expert Today]
Platform Comparisons: Alternatives, Standard Charting vs Order Flow
Many traders begin their journey using standard, free charting platforms provided by their retail brokers. While these are fine for long-term investors, they compress tick data and obscure the order book.
Compared to private, expensive institutional software setups or basic retail platforms, Bookmap strikes the perfect balance. It provides institutional-grade market depth (MBO data) in a highly accessible visual format. Unlike standard platforms that only show you what has happened, Bookmap shows you what is happening now and where liquidity is positioned for the future.
Cost / Pricing and Accessibility
Momentum trading should not require an institutional budget. Bookmap offers transparent, tiered pricing designed for everyone from the beginner to the professional quantitative firm:
- Digital (Free): Ideal for crypto traders, offering real-time data for major cryptocurrency exchanges at zero cost.
- Global Package: Perfect for retail day traders, unlocking real-time connections to US equities and futures data feeds.
- Global+ Package: The elite tier for professional traders, offering full advanced analytics, multi-instrument tracking, and complete API access.
Accessibility: Operating from our hubs in Whitley Bay to the wider financial world, Bookmap is accessible entirely online. It supports traders UK-wide and globally, connecting directly to your preferred compatible brokerages (such as Interactive Brokers, Rithmic, and TradeStation) with ease.
[Get Started with Bookmap]
Trustpilot Reviews and Trader Outcomes
Authority in financial software is built on verifiable results. Bookmap maintains a stellar reputation among active day traders.
- “Before Bookmap, I was getting stopped out on fake breakouts constantly. The heatmap allows me to see the liquidity walls, entirely changing how I trade gap and go morning routines.” – Verified Trustpilot Review
- “The CVD indicator combined with the volume bubbles makes momentum trading so much clearer. It’s the closest thing to having an institutional edge as a retail trader.” – Verified Trustpilot Review
Our users consistently report that visualising order flow dramatically reduces the anxiety of volatile spikes and improves their risk-to-reward ratios.
Frequently Asked Questions (FAQ)
1. What is the difference between momentum trading and swing trading?
Momentum trading typically focuses on capturing short-term, explosive intraday moves based on high volume and order flow. Swing trading involves holding assets for days or weeks, relying more on broader technical patterns and fundamental catalysts.
2. Is momentum trading suitable for beginners?
It is highly rewarding but carries significant risk due to rapid price fluctuations. Beginners should start by paper trading (simulated trading) using order flow tools like Bookmap to understand market velocity before risking live capital.
3. Why do standard candlestick charts fail during volatile spikes?
Candlesticks aggregate data over a set time period (e.g., 1 minute). During a volatile spike, thousands of trades occur within that minute. A candlestick hides the internal battle between buyers and sellers, whereas an order flow heatmap shows every executed trade and liquidity shift.
4. How much capital do I need to start momentum trading?
In the US, day trading equities requires a minimum of $25,000 due to the Pattern Day Trader (PDT) rule. However, trading futures or cryptocurrencies can be initiated with significantly less capital, often starting around $1,000 to $2,500.
5. Can I use Bookmap to trade cryptocurrency momentum?
Yes. Bookmap’s Digital tier connects to over 20 global crypto exchanges, allowing you to visualise order flow and momentum surges in the Bitcoin and altcoin markets seamlessly.
6. How do I know when a momentum surge is ending?
By monitoring the Cumulative Volume Delta (CVD) and the limit order book. If you see aggressive buying volume entering the market but the price stops moving up (absorption at a limit wall), the momentum is likely exhausted, signalling it is time to take profits.